April 2026
New Website & Account Portal

We launched an all-new Symbolik website, showcasing many of the platform's most powerful features and capabilities. As part of the new site, we've also revamped the account portal. Users can now conveniently manage their profile, login, subscriptions, billing and payment from any page outside of the application.
Tabs

Plus and Advanced users can now have up to 30 tabs per workspace, with up to eight charts per tab. Drag and drop tabs to rearrange the order and access tabs offscreen with the overflow menu. You can also rename tabs to make the content easier to identify.
Ticker Tape
.png?width=1120&upscale=true&name=April%202026%20Spotlight_Ticker%20Tape%20(3).png)
For those who prefer to view scrolling prices over a static quoteboard, we now offer a new ticker tape feature. This industry staple provides two different displays, allowing you to monitor a portfolio alphabetically, by list order or by price activity.
Vintage Theme

We kicked off April Fools’ Day with an all-new theme inspired by financial newspapers from a century ago. Weathered with age and handling, this Vintage theme is now permanently available within Symbolik’s system settings. Step back in time with a nostalgic nod to the markets.
Additional Improvements
There have been several additional improvements across the Symbolik platform, including:
- Our interface library was upgraded to improve performance and data transfer while supporting newer web conventions like animations and mouse interactions.
- Symbolik AI now supports table pagination, allowing users to view complete lists of data results. The AI panel also supports clickable symbols for quicker access to relevant charts and data.
- Additional enhancements have been made to analogs, giving users to select analog types before adding them to the chart.
- Minor improvements have been made to Symbol Search, providing more suggestions for each entry.
February 2026
Analog Charting
With our all-new analog charting feature, you can conveniently layer charts like never before. Analogs allow you to overlay multiple charts in the same window, making it easier to visually compare price activity and predict price movement.
Now Symbolik can display up to nine separate analog charts in the same window with shared or independent intervals, dates, times and zoom levels. Move, stack and merge price scales to consolidate or expand data and real estate. Assemble and manage analog charts using the interface or expedite the process using keyboard shortcuts from the symbol search. Isolate and control the active analog chart, or use keyboard hotkeys to pan and zoom all analog charts together. These just scratch the surface as to what analogs can do.
Chart Linking
While chart linking has been a part of the application since launch, we’re now taking things even further with symbol, interval and control linking. Linking is used with multi-chart and analog layouts to streamline your workflow and reduce repetitive entries. Symbol and interval linking update all associated charts as changes are entered, while control linking locks the chart's pan and zoom scale to one another, keeping positioning in sync. The interface continues to rely on a color-coded system, but links can now be modified individually on the fly from the HUD or collectively via the “Manage Links” window.
News
News has been revamped to improve its look and feel. Choose between four layouts, ranging from greater detail to more articles per page. Additionally, Symbolik now now allows you to choose the categories used for top stories and the sources in your news feed, helping you better tailor what you see.
Chart Navigation
Whether you prefer using your mouse or trackpad, keyboard or the chart control interface, navigating charts in Symbolik is simple and intuitive. Now these controls can be accessed using the chart navigation menu in the lower left corner of the chart, providing a consistent location to manage your chart with greater precision. The feature's icon also displays a dot in the center of the four arrows when the chart's position and zoom level have changed from your default settings, making it easier to see when the chart controls can be reset.
Chart Tool Panel Presets
Those who rely heavily on Study and Drawing Tool Presets can now display them in the Chart Tool panel at all times for quicker retrieval. You can still apply custom presets individually using the chart tool’s ellipses menu or the Add Chart Tool modal, but this method keeps things visible and immediately accessible within that panel.
Additional Improvements:
There have been several additional improvements across the Symbolik platform, including:
- More functionality has been added to Symbolik AI to enhance its capabilities and responses.
- Dropdown menus have been added when left clicking the chart's interval and exchange HUD badges, providing an additional way to quickly change these selections.
- You can now sign in to Symbolik using your social media credentials, reducing the number of passwords you need to manage.
- Architectural changes were made to the chart to further improve performance, resulting in faster data load times and interactions.
December 2025
Introducing: Symbolik AI
Trade smarter with real-time market commentary, formula generation and integrated support using our new intelligent assistant.
Turn Data Into Instant Insights
Symbolik AI identifies indicator outputs and statistics, providing additional context to help you understand current market conditions. Summarize price activity, identify study events and perform calculations directly from the chart or the chat panel.
Custom Formulas & Scans Made Simple
Generate, review and troubleshoot Symbolik Scripting Language (SLANG) formulas to create powerful screening conditions and run scans across specific symbols, saved portfolios or full market indices (available with Symbolik Advanced).
Integrated Support Wherever You Work
Get help with platform features, indicators, account questions and more with Symbolik AI. Whether you’re analyzing charts or building formulas, answers are available from anywhere in the platform.
Market News That Matters
Find notable headlines and in-depth articles across assets, sectors and global markets. Get news by ticker, theme or date range, and quickly review the most relevant sources so you never miss critical market developments.
August 2025
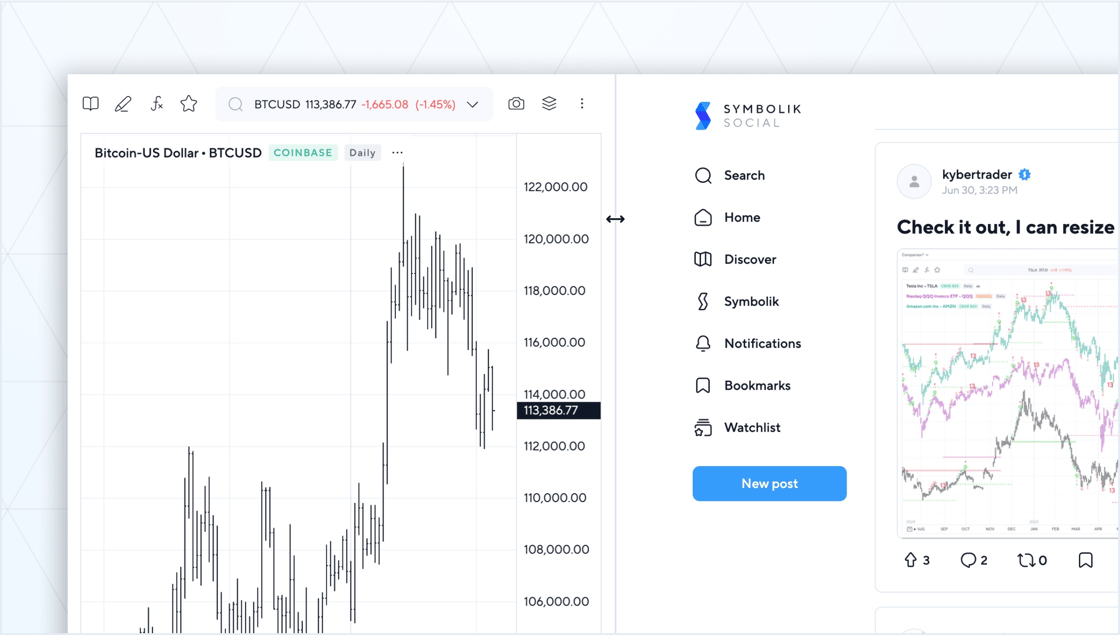
Widget Panel Resizing
The right-hand widget panel is now responsive and resizable, so you can make the most of your screen's real estate. Additionally, each widget retains its width and location, allowing you to switch between features without losing your preferred sizing.
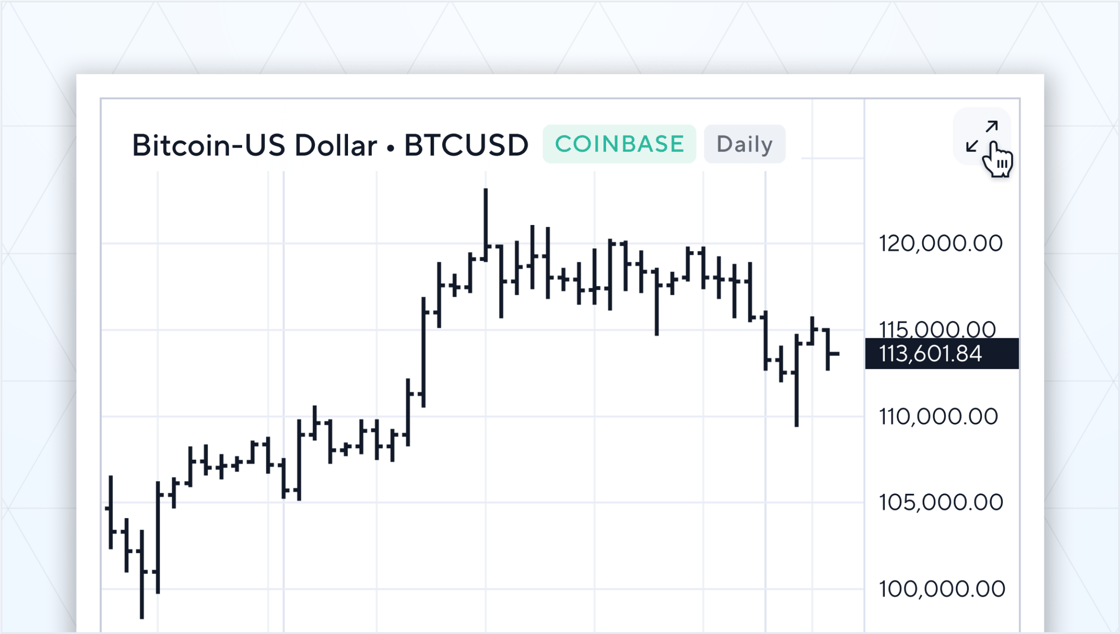
Maximizing Multi-Charts
Individual charts within a multi-chart layout can be maximized from the top corner of the window to make things easier to review. Users can still duplicate a chart in a new tab to create a separate layout, but maximizing the window offers a convenient way to temporarily expand a chart while preserving your existing arrangement.
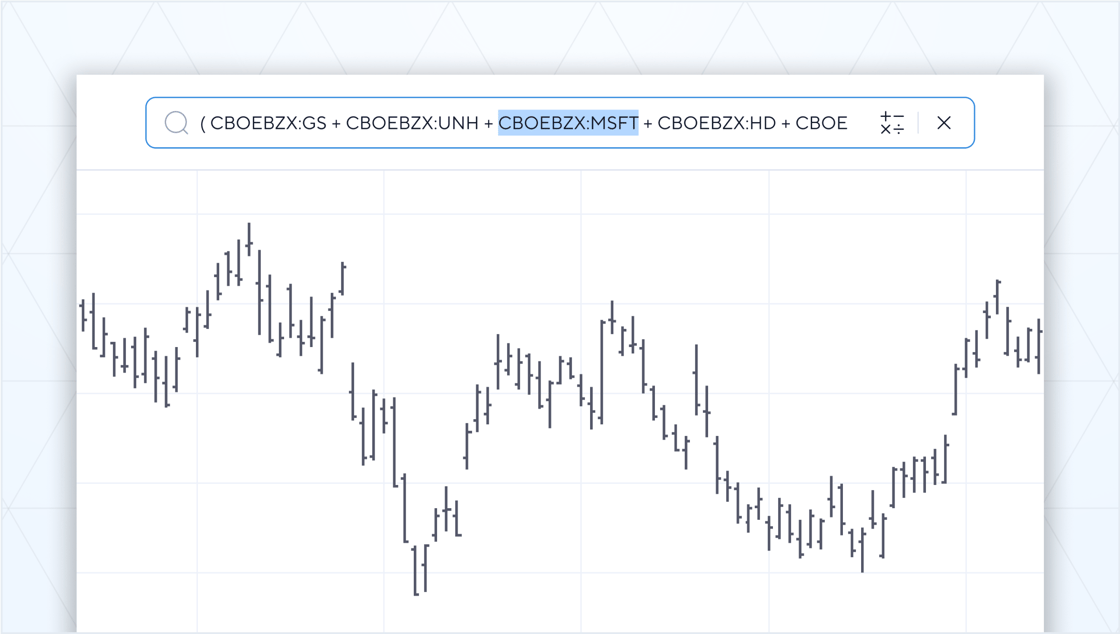
Editing Symbol Search Strings
Clicking the Symbol Search displays the active chart’s symbol code, which can now be modified to change strings more quickly. This is helpful when looking to adjust the symbol or exchange within a single chart, or some portion of a much longer expression.
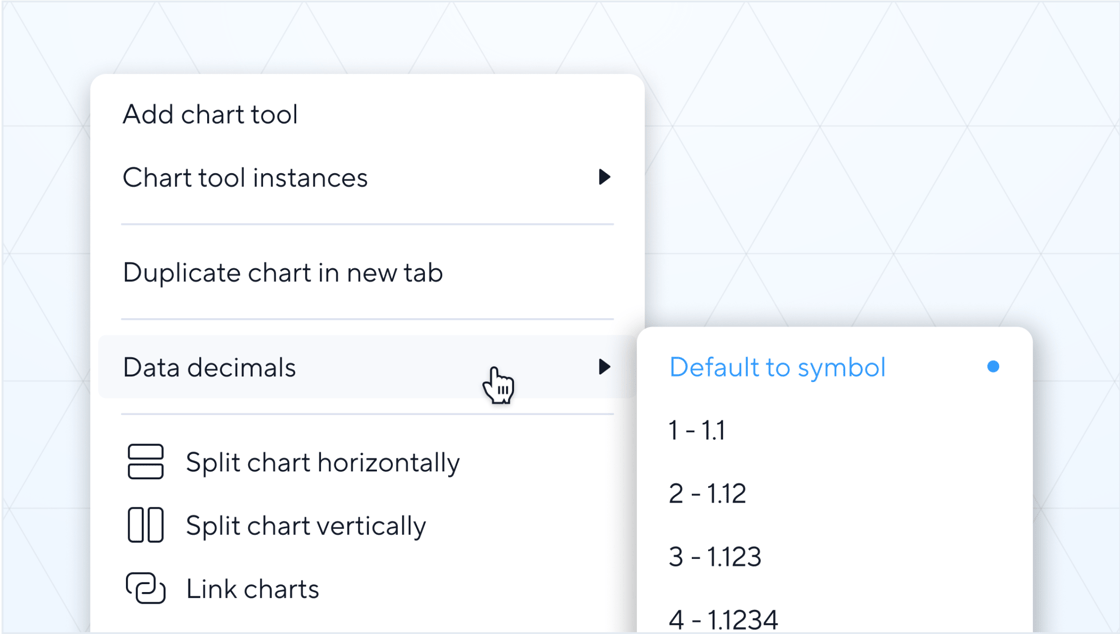
Customize Data Decimals
The number of decimal places displayed in the data can be changed from the chart’s dropdown menus, providing greater precision with values and calculations. Click the chart’s corner ellipses or right-click on the chart itself to adjust the number of decimals from the “Data decimals” flyout menu. When finished, select “Default to symbol” to restore the asset to its original pricing display.
Additional Improvements
There have been numerous additional improvements across the Symbolik platform, including:
- The chart’s Heads-Up Display (HUD) menu is now preserved when refreshing the browser so you can pick up right where you left off.
- Alternative fonts are now available, including fixed-width monospace options to keep data aligned.
- Many options and refinements have been added to the Chart settings menu to make things clearer and to prepare for upcoming feature releases.
- Additional bug fixes and enhancements.
February 2025
Expressions
While custom expressions have been available within charts for some time, now you can save them with a custom name and symbol, allowing for quick retrieval throughout the application. Access saved expressions from the chart’s symbol search menu or integrate them into portfolios, quoteboards, scans, alerts and more.

Chart Preview
Application, chart and chart tool settings are now shown on-screen as changes are made, allowing you to preview how things will look before confirming. This is helpful when considering modifications to display properties as well as studies, drawing tools and conditions, where variables can have a dramatic impact on outputs.

Expanded Intervals
Intervals have been enhanced to support customizable historical time periods. Much like custom intraday intervals can aggregate data into minute and multi-minute time series, historical intervals can now do the same across daily, weekly, monthly, quarterly or annual charts. Intraday intervals continue to work by entering a number into the chart’s symbol search, while expanded historical intervals can be accessed by typing a number followed by that period’s abbreviation (D, W, M, Q, A).

DeMARK Breadth Indices
The DeMARK Breadth Indices are now available exclusively on Symbolik and free for all users. Aggregating the number of default Sequential®, Setup® and Countdown® readings across the S&P 500, the Nasdaq 100 and the Dow Jones Industrial Average, these proprietary metrics offer unique insights into the internal strength or weakness of each benchmark to help identify areas of potential trend exhaustion.

Additional Improvements
There have been numerous additional improvements across the Symbolik platform, including:
• The quoteboard service has been improved for faster sorting and performance.
• Inactive symbols now remain retrievable within the charting feature, allowing you to analyze acquisitions, expirations and delistings long after they’ve stopped trading.
• Removing an unsaved chart tool instance from the chart serves a warning message so you can save the settings as a new preset prior to deletion.
October 2024
Symbolik Scripting Language (SLANG)
We are delighted to announce the launch of our new Symbolik Scripting Language (SLANG), which will serve as the backbone of the platform going forward. Symbolik SLANG offers advanced coding capabilities, a more robust library of technical and mathematical functions, forced symbols, the ability to nest separate studies and conditions, and an improved IntelliSense menu to facilitate the writing of scripts. You can begin utilizing Symbolik SLANG now within the Condition Builder, with additional functionality to follow elsewhere in the future.

Condition Builder 2.0
Along with the release of Symbolik SLANG, substantial upgrades have been made to the Condition Builder’s capabilities. More outputs and functions have been released, allowing you to create richer conditions with less code. The formula writing process has been greatly simplified, with dynamic suggestions as you type to make the experience faster and more intuitive. The toolbox was improved by providing a wizard to walk you through the condition building process, step by step. With these enhancements, your ability to create advanced conditions has never been easier.

Add Chart Tool Interface
An exciting new feature introduced with Symbolik SLANG is the ability to add indicators to indicators. This opens an entirely new way to view and analyze data. Indicators can be applied to instances from the new 'Add chart tool' interface. Chart tools can also be applied to studies and conditions within the Condition Builder, making your conditions even more advanced.

Additional Improvements
- Preserved Drawings: Drawings and annotations can now be preserved when switching between symbols and intervals, allowing you to retrieve your prior work from that specific chart window. This setting is enabled by default, but you can also choose to display a prompt or discard drawings whenever a symbol is changed.
- Chart Color: Chart text and background colors can now be customized within your theme to add more clarity and aesthetic appeal to your work. You can modify this locally from that chart's settings or globally from the "Chart" tab of the system settings.
- Unique Symbol Codes: Symbolik SLANG's ability to specify symbols in one's conditions and scripts introduces a change to the platform symbology. You can continue typing shorthand symbols, but when specifying a distinct symbol for use within expressions and conditions, symbol codes will now begin with the full exchange name, followed by the symbol (e.g. NASDAQ:MSFT).
May 2024
Collapsible Chart Tools Menu
Chart studies, drawing tools, conditions and favorites are all available from the chart tools panel, but now you can make things more compact. In addition to the traditional expanded and hidden states, the collapsed panel can now also be displayed as a toolbar to keep all items immediately accessible while gaining more screen real estate for your charts.

Chart Cursor Controls
- Cursor Magnet pulls the mouse to nearby price outputs to select significant values with greater precision
- Draw Tool Lock persists the active tool for repeated use
- Labels and Lines integrate the display previously limited to the crosshairs and target cursors so this reference information can be utilized across all drawing tools
- Global Cursors allow you to project cursor coordinates for the active chart across a multi-chart layout

Notifications 2.0
Notifications have been revamped to make information easier to retain and retrieve. The bell icon has been relocated to the righthand panel, allowing you to keep the menu open and cycle through notifications without losing your place. System-based notifications have also been added to share important Symbolik announcements and feature releases.

Managing & Layering Chart Tool Instances
You can now manage the layering and arrangement of Chart Tool instances and chart panes to better view outputs and further customize your layout. Access these controls using the Manage Chart Tool Instance icon in the chart menu, within the chart’s corner ellipses menu or from the right-click menu on the chart background.
You can also quickly reorder individual instances and panes from their respective Heads-Up Display (HUD) ellipses menus.

Additional Improvements
- SMS notifications are now available for Scans and Alerts
- Enhancements have been made to the scanning engine, dramatically improving the performance of complex Scans
- Settings modals throughout the application are no longer docked, allowing them to be moved as needed
- Drawing Tools have been refactored to improve rendering speed and responsiveness
- Workspaces have been rebuilt to improve performance throughout the application, including startup, tab changes and splitting charts
- Chart outputs and settings are preserved in your local browser session to ensure stability and data retention during browser refreshes and lost connections